
San Diego Pedestrian Accident Statistics & Risk Areas
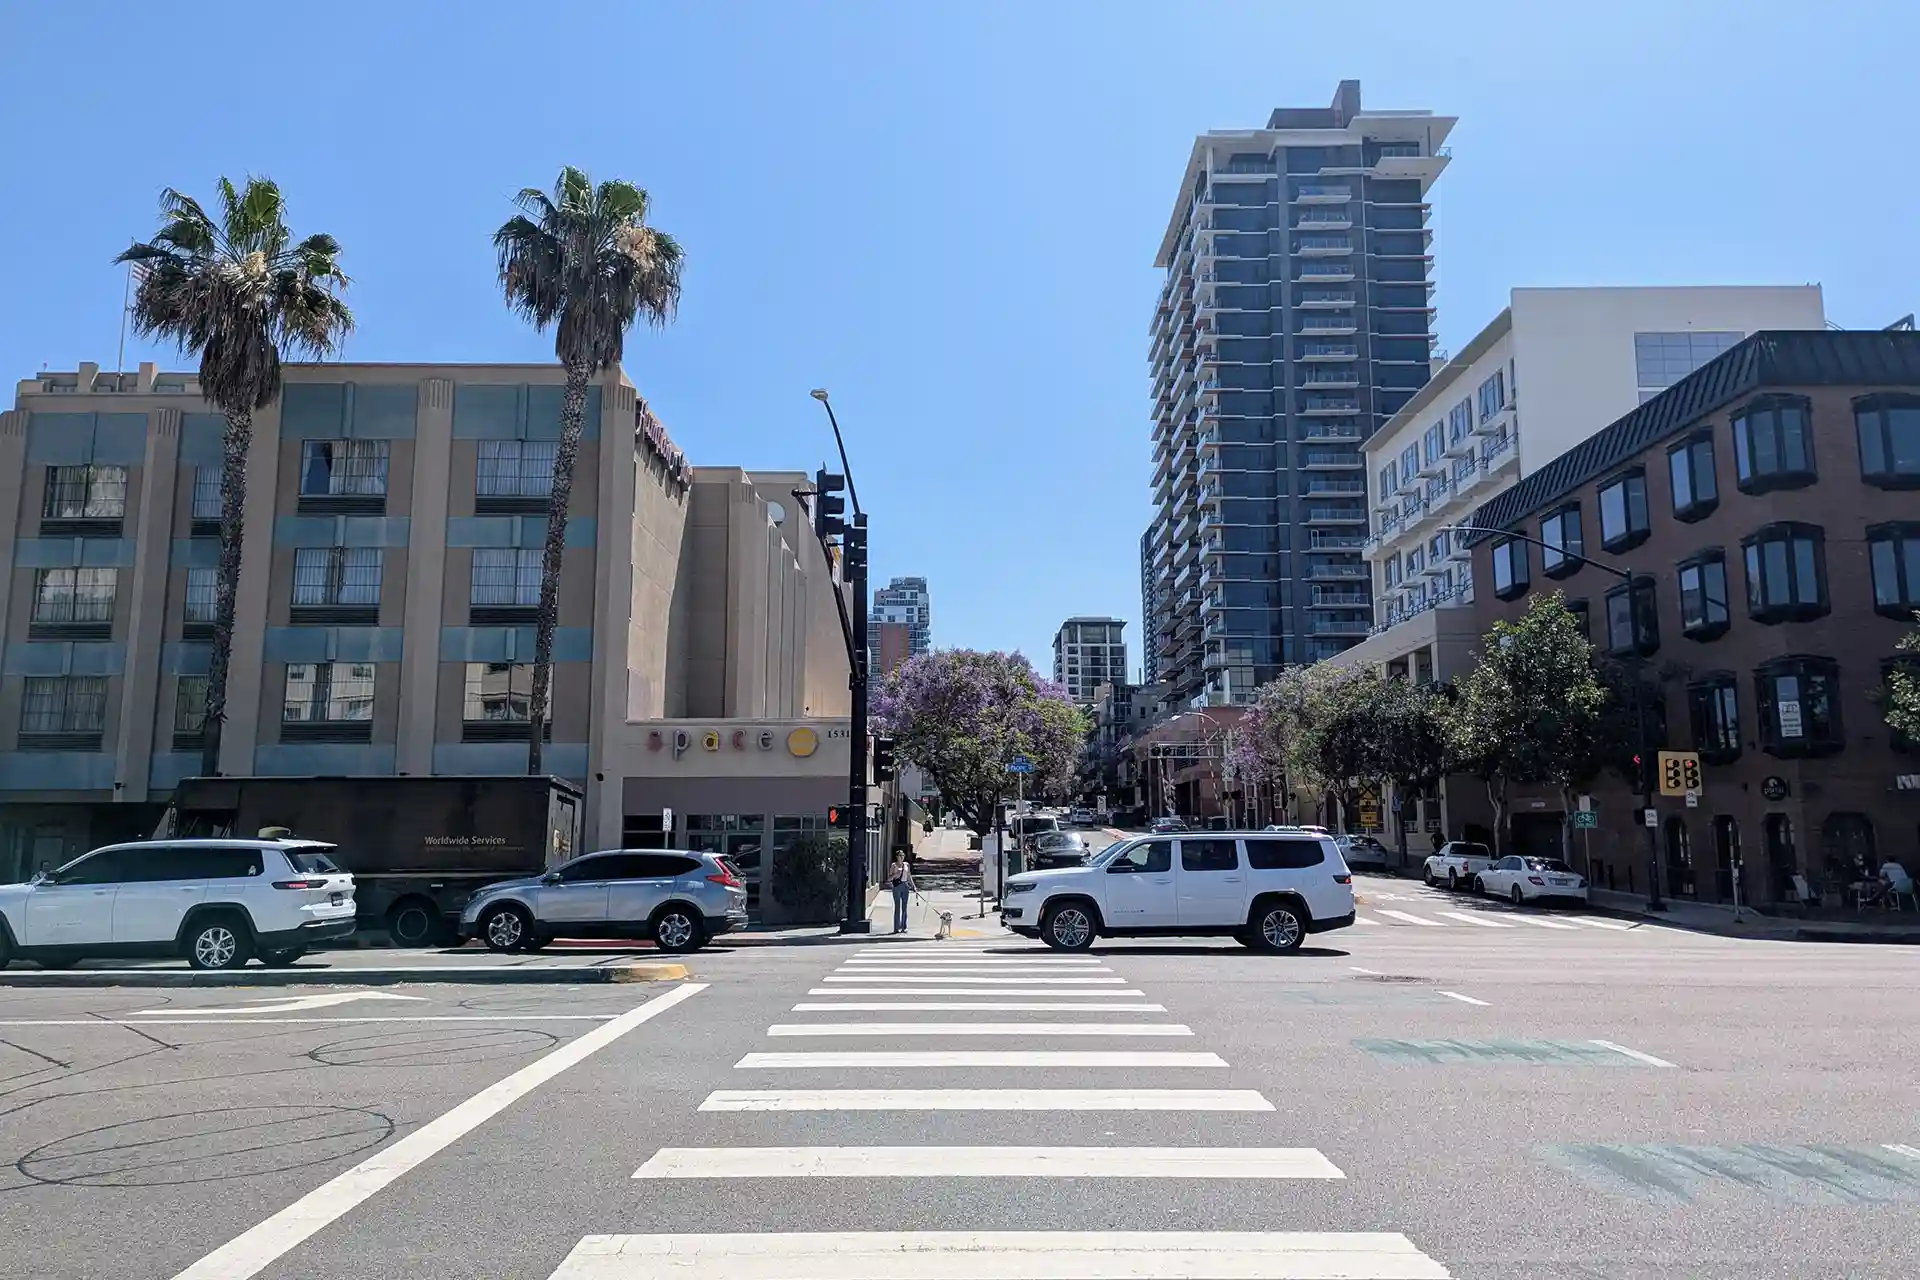
In 2015, San Diego set a public goal: zero pedestrian and bicyclist traffic deaths within ten years. A decade later, more people are being killed while walking the city’s streets than when the count began.
This guide lays out what the data actually shows about pedestrian crashes in San Diego: how many, where, when, and why. If you or someone you love was hurt while walking, these numbers are also the backdrop to a real injury claim, and a San Diego pedestrian accident attorney can explain what they mean for your case.
Overview
In a nutshell, here is what the data shows:
- San Diego’s Vision Zero goal was missed. The city aimed to eliminate pedestrian and cyclist deaths by 2025 and instead saw the number rise.
- Deaths are up over the decade. Non-motorist traffic deaths in the city climbed from 25 in 2014 to 37 in 2023.
- Most fatal crashes happen after dark. Nationally, more than three-quarters of pedestrian deaths occur at night.
- One in four pedestrian deaths is a hit-and-run. The driver flees in a large share of fatal cases.
- Bigger vehicles are deadlier. Light trucks and SUVs account for a majority of pedestrian fatalities.
- Crashes cluster on a few corridors. El Cajon Boulevard, University Avenue, and the downtown grid carry an outsized share.
San Diego’s Vision Zero
In 2015, San Diego adopted Vision Zero, a commitment to eliminate traffic deaths among people walking and biking within ten years. The deadline was 2025. The city did not come close.
A 2024 report from the policy group Circulate San Diego, titled Vision Zero at Ten Years, found that 37 pedestrians and bicyclists were killed on city streets in 2023, compared with 25 in 2014, the year before the commitment. Traffic deaths in San Diego have risen since 2015, and the increase has been driven mainly by pedestrian deaths. By any measure, the streets are more dangerous for people on foot than they were when the city promised to fix the problem.
San Diego pledged in 2015 to reach zero pedestrian and cyclist deaths by 2025. Instead, the annual toll rose from 25 non-motorist deaths in 2014 to 37 in 2023.
This is not a story of inaction. Since 2015 the city has built separated bike lanes, added high-visibility crosswalks, and rebuilt intersections with curb extensions and daylighting. The Circulate report’s point is harder: those measures have not been enough or fast enough to overcome the forces pushing the numbers the other way.
The National Picture
San Diego’s trend mirrors a national one. According to the Governors Highway Safety Association, drivers killed 7,148 pedestrians across the United States in 2024. That figure was down about 4 percent from 2023, the second straight annual decline, but it remained nearly 20 percent above the 2016 level, and pedestrian deaths had reached a 40-year high just two years earlier, in 2022.
California reflects the same pattern. The state recorded roughly 928 pedestrian deaths in 2024 by preliminary count, a double-digit drop from the year before. The recent two-year dip is real and welcome, but it follows a decade of sharp increases, and it has not undone them. A single good year does not reverse a ten-year climb.
When and How Pedestrian Crashes Happen
The data shows clear, repeating patterns in how pedestrians are killed and seriously hurt.
- After dark. More than three-quarters of pedestrian fatalities nationally happen at night. Reduced visibility, combined with drivers who do not slow down for conditions, makes the hours after sunset the most dangerous for people on foot.
- Hit-and-run. About one in four pedestrian deaths involves a driver who fled the scene. San Diego’s nightlife corridors see a particular concentration of these crashes, a pattern covered in our guide to hit-and-run pedestrian accidents in San Diego.
- Larger vehicles. Light trucks and SUVs now account for a majority of pedestrian fatalities where the vehicle type is known, far more than passenger cars. Their taller, blunter front ends strike a pedestrian higher on the body and are more likely to knock a person down and under the vehicle rather than over it. When the vehicle is a commercial truck, the outcome is worse still; see our San Diego truck accident statistics for the local numbers.
- Speed. The single biggest predictor of whether a pedestrian crash is fatal is vehicle speed at impact. A person struck at 20 miles per hour usually survives; the odds of death climb steeply from there.
More than three in four pedestrians killed nationally are struck after dark, and roughly one in four fatal pedestrian crashes is a hit-and-run.
These patterns are not just statistics. They shape how a crash is investigated, which is why the common causes of pedestrian accidents in California map closely onto the categories above.
Who Is Most at Risk
Pedestrian risk is not shared equally, and the data shows clear patterns in who is hurt and killed.
Older adults are especially vulnerable. National traffic-safety data consistently shows that people 65 and older are killed in pedestrian crashes at a higher rate than younger adults, both because the same impact is more likely to be fatal for an older body and because recovery is harder. Children are at heightened risk too, particularly near schools and in residential neighborhoods where they walk and play. Across every age group, men are killed as pedestrians at notably higher rates than women.
Pedestrian deaths also fall unevenly across neighborhoods. Nationally and in California, fatal pedestrian crashes concentrate in lower-income communities, which tend to have wider and faster arterial roads, fewer marked crossings, and less investment in sidewalks and lighting. That disparity was part of the reason California passed the Freedom to Walk Act in 2023, which curbed jaywalking enforcement that had fallen disproportionately on those same communities, a change explained in our guide to pedestrian right-of-way laws in California.
One more point of perspective: deaths are only the most-counted part of the picture. For every pedestrian killed, many more survive with serious, life-altering injuries, and those crashes follow the same patterns of age, place, and time.
San Diego’s High-Risk Corridors
Pedestrian crashes are not spread evenly across San Diego. A core idea behind Vision Zero is the high-injury network: a small share of a city’s streets carries a hugely disproportionate share of its severe and fatal crashes. Focus safety work on those streets, and you reach most of the problem.
In San Diego, the same names come up repeatedly. Circulate San Diego’s earlier work identified a set of the city’s most dangerous intersections, the “Fatal 15,” concentrated on corridors like El Cajon Boulevard, University Avenue, 4th Avenue, and the downtown grid. The regional planning agency, SANDAG, tracks collision data across the county and publishes it through a public traffic-safety dashboard. The corridors that show up in the data are the long, fast, multi-lane commercial streets where heavy foot traffic meets fast-moving vehicles. Our guide to the most dangerous intersections for pedestrians in San Diego goes deeper on these locations and on what makes a specific crossing dangerous.
Why the Numbers Keep Rising
If San Diego has been building safer streets, why has the toll gone up? The Circulate San Diego report and national research point to a few forces working against the city.
The first is vehicle size. The shift toward larger, heavier light trucks and SUVs has made the average crash more deadly, independent of anything a city does to its streets. The second is the pace of infrastructure: safety projects, especially larger rebuilds, move slowly from plan to pavement, while the risks on the ground do not wait. The third is growth and street design. San Diego has grown quickly, and it remains a city built primarily to move cars rather than to protect people on foot. More vehicles on car-first streets means more conflict between drivers and pedestrians, and over time that makes serious crashes a matter of statistical likelihood rather than chance.
What These Statistics Mean for Your Case
For someone who was injured, the data is more than background. It can matter directly to a claim.
A documented history of crashes at a particular intersection or corridor can help establish that a government agency was on notice of a dangerous condition, which is a required element of a claim against a public entity for a dangerous condition of public property. The crash patterns also guide the investigation: a nighttime crash puts lighting and visibility in focus, a hit-and-run shifts the work toward your own insurance coverage, and a large-vehicle impact shapes the medical and reconstruction analysis. How that evidence becomes a case is covered in our guides to proving liability in a pedestrian accident and the compensation available to pedestrian accident victims.
What the statistics cannot do is value an individual case. Every case turns on its own facts: the severity of the injuries, the clarity of fault, and the insurance coverage available. The numbers describe the risk; they do not predict any one outcome.
Hulburt Law Firm
Behind every figure in this guide is a person and a family. If you are one of them, the statistics matter far less than the specifics of what happened to you, and those specifics deserve a careful, experienced look.
At Hulburt Law Firm, attorney Conor Hulburt and his team handle catastrophic injury and wrongful death cases throughout San Diego County. We investigate the crash, identify every responsible party, and pursue the full recovery an injured pedestrian is owed. You pay nothing unless we recover compensation for you.
Call us at (619) 821-0500 or contact us for a free, no-obligation consultation about your pedestrian accident case.
Request a Free Case Review
Simply fill out the form or call 619.821.0500 to receive a free case review. We’ll evaluate what happened, your injuries, and potential defendants to determine how we can best help you.

Hulburt Law Firm handles serious personal injury and wrongful death cases throughout San Diego County.


