
San Diego Truck Accident Statistics (2014-2024)
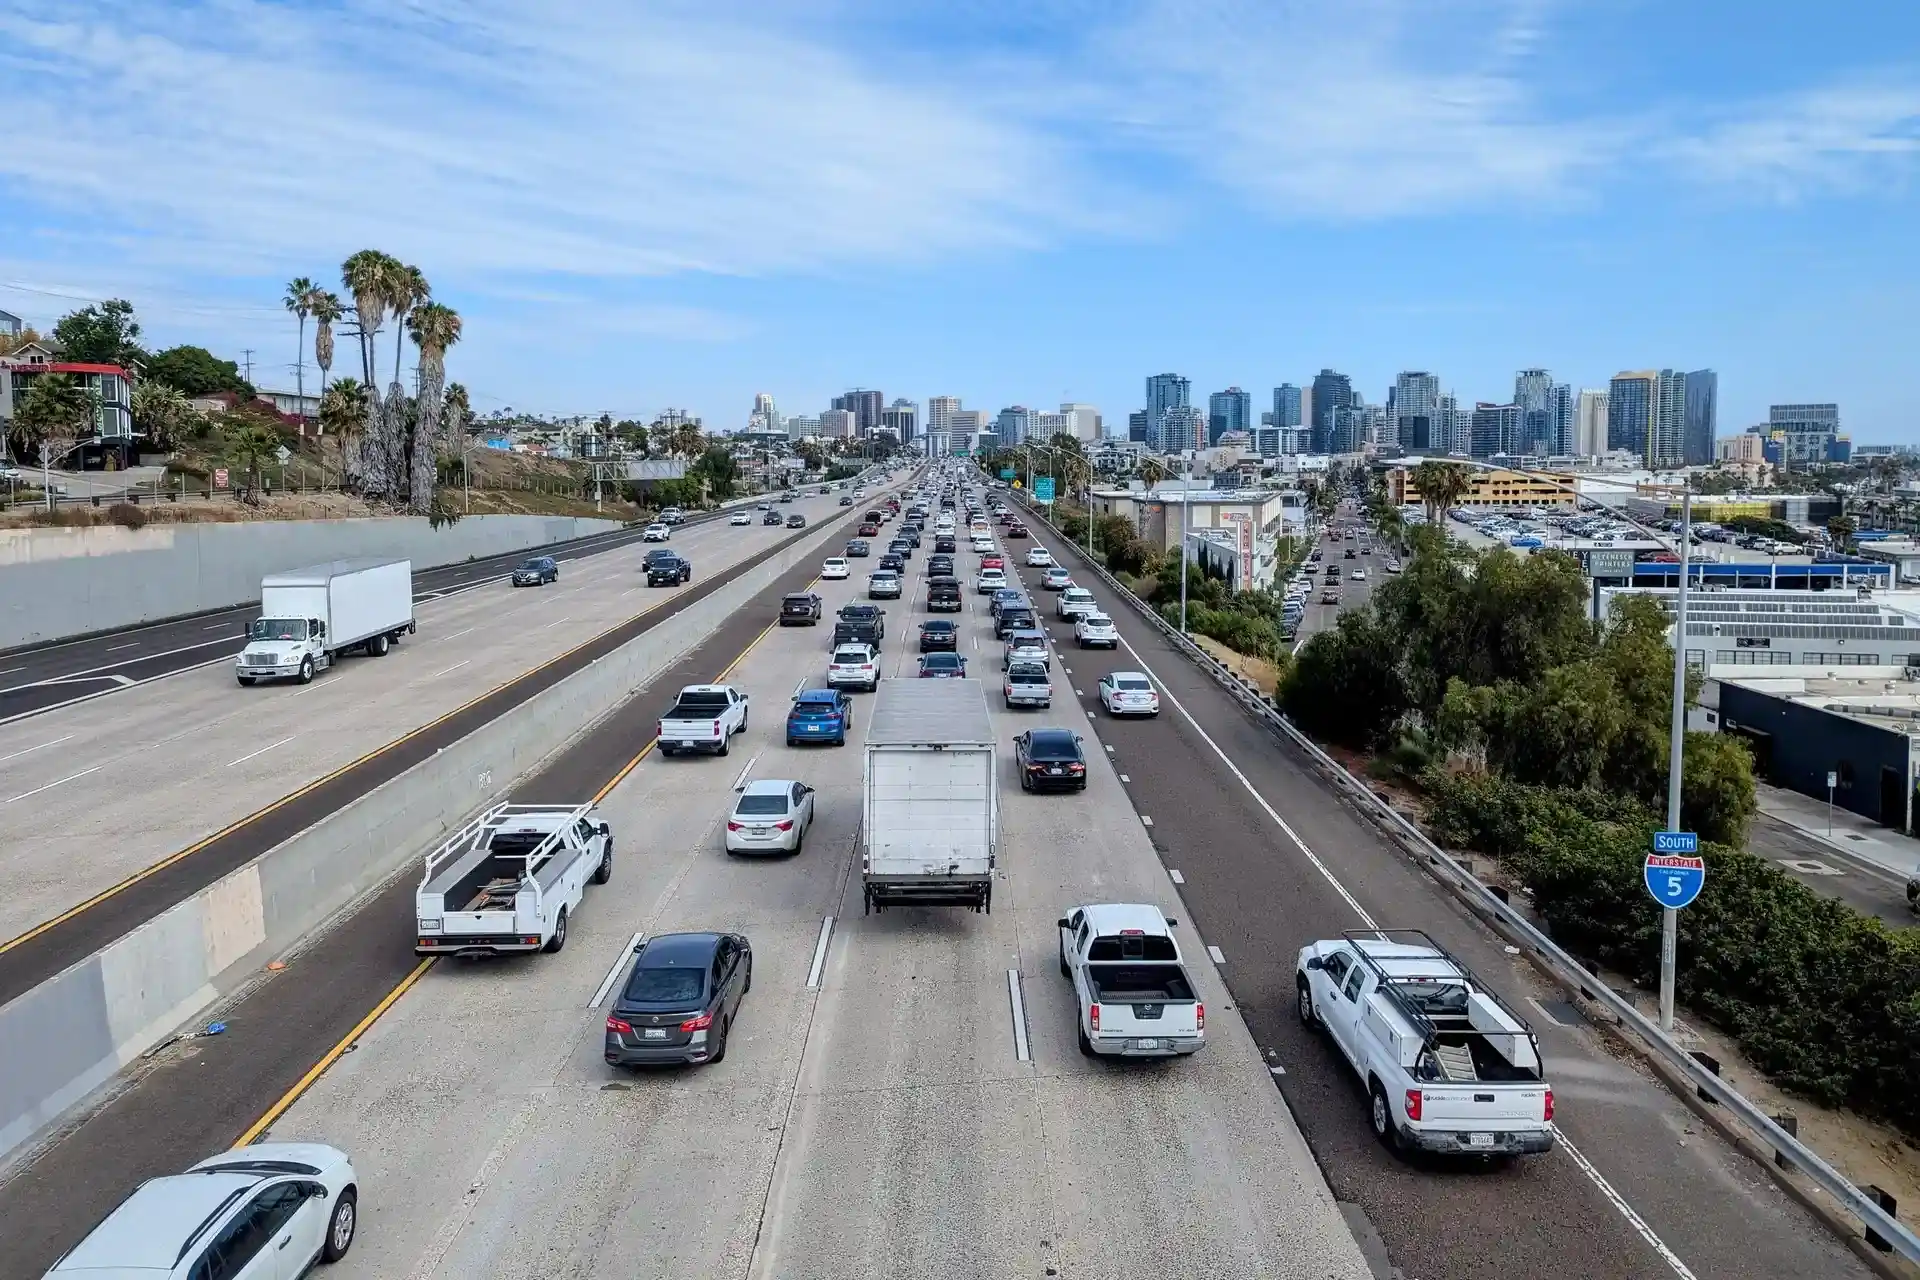
Truck crashes causing injury or death have become more common in San Diego County over the past decade. From 2014 through 2024, law enforcement reported 3,890 injury or fatal crashes involving big trucks, resulting in 5,163 injuries and 174 deaths.
The trend has moved upward. San Diego County recorded 412 injury or fatal truck crashes in 2024, the highest total in the 2014-2024 period and about 38 percent more than in 2014. Nearly 58 percent of these crashes occurred on or near a state highway, with Interstate 15 and Interstate 5 accounting for more than one-quarter of the county’s truck crashes.
This article analyzes the 2014-2024 study period using crash records from the California Highway Patrol’s Statewide Integrated Traffic Records System (SWITRS). We use 2014-2024 for the historical comparisons throughout the article because more recent 2025 and 2026 records remain provisional and subject to change.
For people dealing with the consequences of a serious commercial vehicle collision, our San Diego truck accident attorney page explains how these cases are investigated, the evidence that may need to be preserved, and the parties that may be legally responsible.
How Many Truck Accidents Happen in San Diego County?
From 2014 through 2024, San Diego County averaged about 354 injury or fatal truck crashes a year, nearly one every day.
San Diego County Truck Crashes by Year
Crashes rose in most years, and 2024 was the highest of the eleven complete years.
| Year | Crashes | Injured | Killed |
|---|---|---|---|
| 2014 | 298 | 394 | 15 |
| 2015 | 331 | 441 | 13 |
| 2016 | 311 | 442 | 6 |
| 2017 | 331 | 441 | 18 |
| 2018 | 348 | 461 | 14 |
| 2019 | 405 | 523 | 21 |
| 2020 | 337 | 410 | 19 |
| 2021 | 353 | 457 | 20 |
| 2022 | 366 | 482 | 17 |
| 2023 | 398 | 558 | 14 |
| 2024 | 412 | 554 | 17 |
| 2025* | 403 | 519 | 5 |
*2025 figures are provisional.
Source: California Highway Patrol SWITRS data.
The trend is upward. The five years from 2020 through 2024 averaged 373 crashes annually, compared with 324 a year from 2014 through 2018.
Injuries and Deaths
San Diego County reported 3,890 truck crashes from 2014 through 2024 that resulted in 174 deaths and 5,163 injuries. Classified by the most serious injury suffered by anyone involved, this includes:
- 163 crashes killed at least one person.
- 303 crashes caused a suspected serious injury, a category that includes injuries such as broken bones, internal injuries, and severe head trauma.
- 1,285 crashes caused a visible or minor injury.
- 2,139 crashes caused a possible injury or complaint of pain.
Of the 174 people killed, 102 were drivers, 35 were pedestrians, 31 were passengers, 4 were bicyclists, and 2 were other road users.
Only 179 of the 3,890 crashes involved a pedestrian, fewer than 5 percent, yet pedestrians accounted for 20 percent of the deaths. The same vulnerability appears in San Diego pedestrian crash data generally, but the disparity is even greater when a truck is involved.
Where Truck Accidents Happen in San Diego County
Truck crashes in San Diego County are primarily a freeway problem. About 58 percent occurred on or near a state highway, and four freeways account for about 43 percent of all truck crashes in the county.
The Freeways With the Most Truck Crashes
Interstate 15 and Interstate 5 lead by a wide margin over every other route in the county.
| Freeway | Truck crashes |
|---|---|
| Interstate 15 | 563 |
| Interstate 5 | 502 |
| Interstate 805 | 331 |
| Interstate 8 | 267 |
| State Route 78 | 130 |
| State Route 94 | 94 |
| State Route 76 | 65 |
| State Route 67 | 63 |
| State Route 52 | 62 |
| State Route 125 | 58 |
| State Route 163 | 39 |
| Interstate 905 | 27 |
Source: California Highway Patrol SWITRS data.
Interstate 15 is a major freight route connecting the border region with the Inland Empire. Interstate 5 carries commercial traffic along the coast and connects San Diego with the border region. Together, I-15 and I-5 account for more than a quarter of all truck crashes in the county.
Truck Crashes by City
The city of San Diego and the unincorporated county together account for about 61 percent of the total.
| City or area | Truck crashes |
|---|---|
| San Diego | 1,402 |
| Unincorporated county | 958 |
| Escondido | 308 |
| Chula Vista | 218 |
| Oceanside | 169 |
| Carlsbad | 158 |
| El Cajon | 156 |
| San Marcos | 95 |
| National City | 74 |
| La Mesa | 70 |
| Encinitas | 67 |
| Vista | 54 |
Source: California Highway Patrol SWITRS data.
Escondido sits at the junction of Interstate 15 and State Route 78, two of North County’s busiest transportation corridors, and recorded more truck crashes than any city outside San Diego itself.
When Truck Accidents Happen
San Diego County truck crashes are concentrated during the workweek and during daytime hours.
- About 84 percent happen Monday through Friday.
- Roughly 70 percent happen between 6 a.m. and 6 p.m.
- The busiest period is late morning through midafternoon.
That pattern tracks when commercial freight and delivery activity is heaviest.
What Causes Truck Accidents in San Diego County?
The Leading Causes
| Primary cause | Crashes | Share |
|---|---|---|
| Unsafe speed | 1,414 | 36.3% |
| Improper turning | 770 | 19.8% |
| Driving under the influence | 322 | 8.3% |
| Unsafe lane change | 311 | 8.0% |
| Automobile right of way | 277 | 7.1% |
| Traffic signals and signs | 234 | 6.0% |
| Following too closely | 74 | 1.9% |
| Unsafe starting or backing | 71 | 1.8% |
Source: California Highway Patrol SWITRS data.
Who Officers Found at Fault
Among crashes in which the reporting officer identified an at-fault party, the truck driver was assigned fault in about 42 percent. Someone else was assigned fault in about 58 percent, most often the driver of a passenger vehicle.
The Most Common Types of Collisions
| Collision type | Crashes | Share |
|---|---|---|
| Rear-end | 1,670 | 42.9% |
| Sideswipe | 858 | 22.1% |
| Broadside | 657 | 16.9% |
| Hit object | 222 | 5.7% |
| Head-on | 160 | 4.1% |
| Vehicle and pedestrian | 130 | 3.3% |
| Overturned | 125 | 3.2% |
Source: California Highway Patrol SWITRS data.
Among the 163 crashes that killed someone, rear-end collisions ranked first with 58. But truck-pedestrian collisions ranked second with 30 fatal crashes, despite accounting for only 3.3 percent of truck crashes overall.
Broadside collisions accounted for 19 fatal crashes, sideswipes for 17, and head-on collisions for 14. The type of truck collision often shapes both the injuries involved and the evidence needed to determine what happened.
How San Diego Compares to Los Angeles and Riverside Counties
Raw crash totals do not tell the whole story because the three counties have very different populations. Using 2020 Census population figures and the same 2014 through 2024 period produces a more useful comparison:
| Measure | San Diego | Los Angeles | Riverside |
|---|---|---|---|
| Truck crashes | 3,890 | 19,773 | 5,476 |
| People killed | 174 | 663 | 295 |
| Crashes per 100,000 residents per year | 10.7 | 18.0 | 20.6 |
| Deaths per 100,000 residents per year | 0.48 | 0.60 | 1.11 |
| Deaths per 100 crashes | 4.5 | 3.4 | 5.4 |
| Share of crashes fatal or serious | 12.0% | 10.2% | 14.4% |
Source: California Highway Patrol SWITRS data.
San Diego County has the lowest per-capita truck crash rate of the three. Riverside County’s rate is nearly twice San Diego’s, at 20.6 crashes per 100,000 residents per year compared with 10.7. Los Angeles County’s rate is about 68 percent higher than San Diego’s.
The Deadliest Truck Corridors in Southern California
The table below compares major truck corridors in San Diego, Los Angeles, and Riverside Counties by deaths per 100 crashes. Only routes with at least 150 truck crashes from 2014 through 2024 are included.
| Corridor | County | Crashes | Killed | Deaths per 100Deaths/100 |
|---|---|---|---|---|
| Interstate 10I-10 | Riverside | 1,085 | 83 | 7.6 |
| Interstate 5I-5 | San Diego | 502 | 32 | 6.4 |
| Interstate 15I-15 | San Diego | 563 | 31 | 5.5 |
| Interstate 15I-15 | Riverside | 538 | 27 | 5.0 |
| Interstate 8I-8 | San Diego | 267 | 12 | 4.5 |
| State Route 57SR-57 | Los Angeles | 212 | 9 | 4.2 |
| Interstate 105I-105 | Los Angeles | 330 | 13 | 3.9 |
| U.S. 101US-101 | Los Angeles | 638 | 25 | 3.9 |
| Interstate 5I-5 | Los Angeles | 2,115 | 76 | 3.6 |
| Interstate 210I-210 | Los Angeles | 1,184 | 41 | 3.5 |
Source: California Highway Patrol SWITRS data.
Three of the five major corridors with the highest deaths per 100 crashes are in San Diego County. Interstate 5, Interstate 15, and Interstate 8 each have a higher death rate per 100 crashes than any qualifying Los Angeles County freeway in the comparison.
About the Data
The statistics in this article come from the California Highway Patrol’s Statewide Integrated Traffic Records System (SWITRS), accessed through UC Berkeley SafeTREC’s Transportation Injury Mapping System (TIMS). TIMS provides tools for querying, mapping, and analyzing California’s SWITRS crash records.
Our primary analysis uses the 2014-2024 period. We exclude 2025 and 2026 from historical comparisons because recent SWITRS records remain provisional and can change as CHP completes its reporting process. The dataset includes reported crashes involving a big truck in which at least one person was injured or killed. Property-damage-only crashes are not included.
How Hulburt Law Firm Can Help
If you or someone in your family was hurt in a truck accident in San Diego County, the statistics on this page describe broader patterns. They do not tell you what caused a particular crash.
That requires examining the evidence: the truck’s electronic data, the driver’s logs, maintenance and inspection records, dispatch information, company policies, and other evidence that may show what happened and why. Preserving that evidence early can make a significant difference.
If a truck crash took someone you love, a wrongful death claim involves its own legal issues and deadlines.
Call (619) 821-0500 or message us through our contact form for a free, confidential case review. There is no fee unless we win.
Request a Free Case Review
Simply fill out the form or call 619.821.0500 to receive a free case review. We’ll evaluate what happened, your injuries, and potential defendants to determine how we can best help you.

Hulburt Law Firm handles serious personal injury and wrongful death cases throughout San Diego County.


